If you’re facing issues with your browser – slowness, unexpected crashes, network problems, GPU issues – then using the hidden or internal URLs in Google Chrome can give you deep diagnostics which are otherwise not exposed via the regular UI. In this article we’ll cover how to access these secret pages, what each page does, how to interpret the data, and best practice steps to fix typical problems. Whether you’re a developer, power user in Delhi/India or a general user, you’ll find useful tips.
What Are Chrome’s Secret Diagnostic URLs?
The browser Chrome is built on the Chromium platform and exposes many internal pages via special URL schemes of the form chrome://…. These pages are not part of the standard Settings menu, but provide diagnostic, debugging, performance and configuration information.
For example, typing into the address:
…displays version info, OS, command line switches and more. These URLs are often referred to as “secret” because normal users seldom know about them.
Why Use Chrome’s Secret Diagnostic URLs?
- See hardware/driver status (GPU, audio, etc)
- Check network logs and error states
- View crash reports or tab-renderer errors
- Access experimental or hidden flags/features
- Determine if extensions or policies are interfering
- Troubleshoot performance / memory / battery issues
Using them effectively can reduce downtime and help you identify root causes rather than just symptoms.
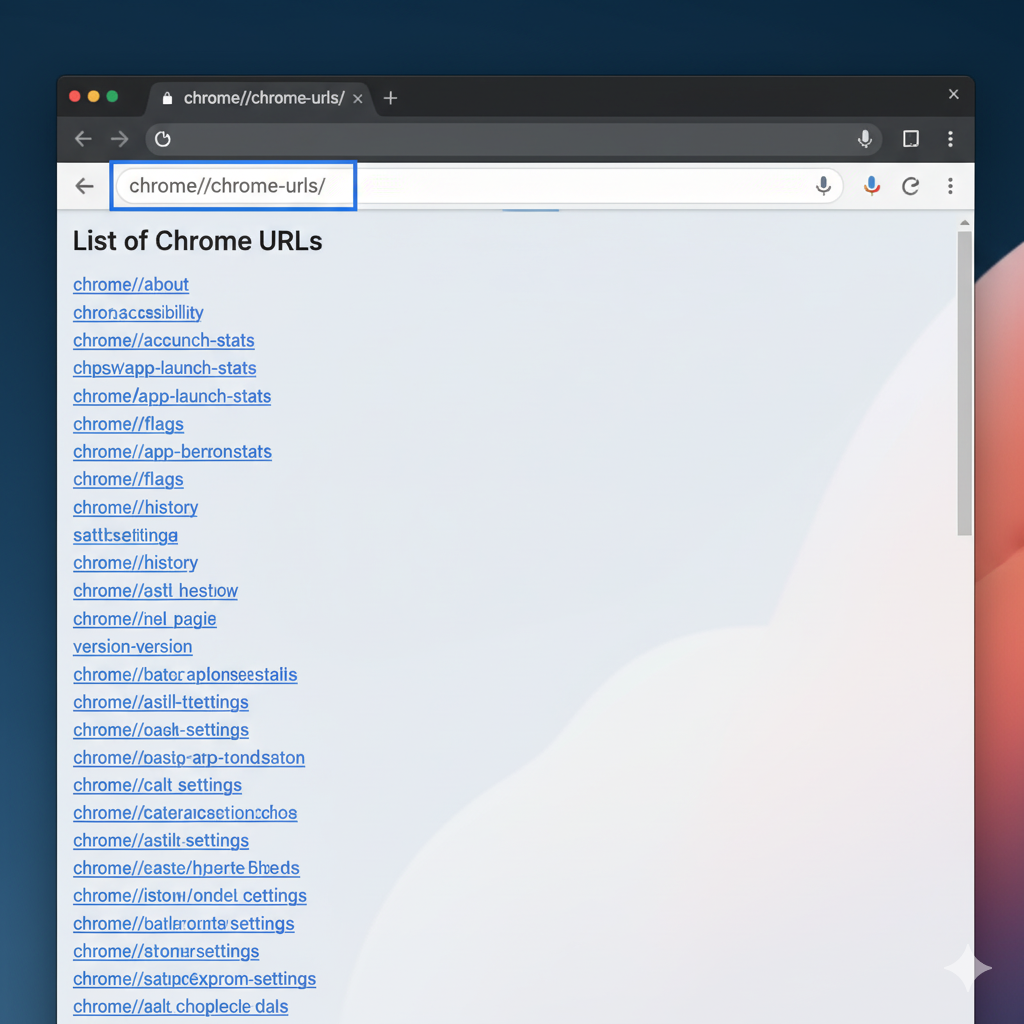
How to Access the Full List of Chrome Internal URLs
Before diving into specific ones, you can see a master list of available internal pages.
- Open Chrome.
- In the address bar, type:
chrome://chrome-urls/orchrome://about/These pages show a clickable list of many available internal URLs.
or
These pages show a clickable list of many available chrome internal URLs.
3. Browse through the list and identify pages relevant to your issue.
Important note: Some URLs are flagged as “dangerous”, experimental or may cause instability. Use with care.
Common Diagnostic URLs and What They Do
Here is a table summarising some of the most useful internal pages, along with their purpose and when you should use them:
| URL | Purpose | Use Case |
|---|---|---|
chrome://version | Shows Chrome version, OS, channel, command-line switches, profile path | To check you’re on latest version or identify build/channel issues |
chrome://gpu | Displays GPU acceleration status, driver fallback, feature availability | When graphics are buggy, videos lag or GPU acceleration seems disabled |
chrome://net-export | Allows you to record network logs (NetLog) for export | For network issues such as slow loading, DNS problems, HSTS errors |
chrome://crashes | Shows history of crash reports (if crash reporting enabled) | When Chrome keeps crashing or tabs are unexpectedly closing |
chrome://components | Lists Chrome components (Widevine, etc) and ability to update them | When e.g. video DRM issues occur or plugins fail |
chrome://policy | Lists applied enterprise/user policies | When you are on a managed device or policy is preventing certain features |
chrome://flags | Experimental features and flags you can enable/disable | When you want to test features or disable one causing issues |
chrome://system | Snapshot of system information: OS, CPU, memory, command list | For a full-system overview when troubleshooting complex issues |
chrome://extensions-internals | Internal view of extensions, their errors and states | If you suspect a browser extension is causing issues |
chrome://site-engagement | Shows how much each site is “engaged” by Chrome (heuristic) | Rarely used, but useful in advanced analytics/advertising scenarios |
Explaining the Table
- The URL column gives the internal address you type in Chrome’s address bar.
- The Purpose explains what kind of data you’ll see.
- The Use Case helps you decide when to open that URL.
For example: if videos are choppy on YouTube, GPU acceleration might be disabled or driver issues present — open chrome://gpu to see if Chrome is falling back to software rendering. If so, you might need to update your GPU driver, disable hardware acceleration in settings, or investigate conflicts.
Step-By-Step Troubleshooting Workflows
Let’s walk through three typical problem scenarios you might face with Chrome (on Windows, Mac, Linux) and how you can use secret diagnostic URLs in a structured workflow.
Scenario 1: Chrome is Slow / Webpages Loading Slowly
Step 1: Check version/build
- Open
chrome://version - Verify you’re on latest stable channel; note command-line switches that might indicate interference (e.g., malware or corporate policy).
Step 2: Check network internals
- Open
chrome://net-export - Click “Start Logging to Disk”, reproduce the problem (open slow tab/page)
- Stop logging, save the log, then use the NetLog viewer (online) to inspect DNS time, connection handshakes, http/2 or http/3 issues.
- Alternatively open
chrome://network-errorsto see known error pages.
Step 3: Check flags and extensions
- Open
chrome://flags→ search for any enabled experimental flags that may slow the browser, disable suspicious ones and relaunch. - Open
chrome://extensions-internals→ sort by errors, disable recently added extensions and test again.
Step 4: Check GPU / hardware acceleration
- Open
chrome://gpu - Ensure that “Hardware accelerated” is enabled (or disabled if causing issues).
- If many features are “Unavailable” or “Software only” fallback, consider updating GPU driver or turning off “Use hardware acceleration when available” in Regular Settings.
Step 5: Check memory/processor usage
- Open
chrome://system→ look at memory and CPU data. - Open Task Manager via
Shift + Escinside Chrome. See if a tab or extension hogs resources, causing slowdown.
Scenario 2: Chrome Crashes or Tabs Close Unexpectedly
Step 1: View crash history
- Open
chrome://crashes - If no entries appear, ensure “Report usage statistics and crash reports” is enabled in settings.
Step 2: Check for policies
- Open
chrome://policy - If your device is managed (like corporate laptop), there may be enforced policies causing instability or blocking updates/extensions.
Step 3: Inspect component updates
- Open
chrome://components - Click “Check for update” on key components (Widevine, CRLSet etc.). Outdated components can cause plugin or security crashes.
Step 4: Reproduce crash and capture logs
- Use
chrome://net-exportif crash occurs during page load or network activity. - Use
chrome://histogramsorchrome://metrics-internalsfor advanced users to capture performance / event histograms.
Scenario 3: GPU/Video Issues – Choppy Playback, Black Screen, Hardware Acceleration Problems
Step 1: Check GPU status
chrome://gpu— look at “Graphics Feature Status”. If many are “Disabled” or “Software only”, GPU acceleration is not properly used.
Step 2: Check flags
- In
chrome://flagssearch for “hardware‐acceleration” or “zero‐copy” or “vpx decoding” (depending on version). If you’re using experimental flags, try disabling them to see if stability improves.
Step 3: Check extensions/plugins
chrome://extensions-internals— video‐related extensions or overlay tools may interfere with GPU usage. Disable them temporarily.
Step 4: Update driver / Chrome version
- Use
chrome://versionto find build number and channel. If you’re on an old version or beta channel, consider switching to stable. - Update GPU driver from your vendor.
Step 5: Run a trace (advanced)
chrome://tracing (if available) allows you to record render traces. This is advanced but gives deep insight into GPU/CPU interplay.
Best Practice Table for Using Diagnostic URLs
Here is a handy table of best practices when working with these internal URLs:
| Task | Recommended Internal URL | What to Check | Action |
|---|---|---|---|
| Check Chrome version & build | chrome://version | Channel (Stable/Beta), build number, command line | Update or switch channel if old |
| Find GPU/graphics issues | chrome://gpu | Hardware acceleration status, driver fallback | Update driver, disable hardware acc. |
| Diagnose network / page load | chrome://net-export | DNS delays, connection errors, http/2 failures | Analyze NetLog, clear DNS cache |
| Inspect crash history | chrome://crashes | Crash count, last crash date | Disable suspect extensions or reset profile |
| Check components & updates | chrome://components | Outdated modules (Widevine, CRLSet) | Click “Check for update” |
| Review enterprise/managed policies | chrome://policy | Active policies blocking features | Remove or adjust if allowed |
| Toggle experimental features | chrome://flags | Enabled/Disabled flags, stability warnings | Disable risky flags, relaunch browser |
| Inspect extensions diagnostics | chrome://extensions-internals | Error count, resource usage | Disable heavy or buggy extensions |
Using this table as a quick guide can help you systematically approach issues rather than randomly guessing.
Tips for Indian/Delhi Users: Local Considerations
If you’re in India (Delhi/NCR) or facing regional network constraints, here are extra tips:
Browser version on local ISPs: Some network issues relate to proxy or VPN setups – check chrome://system for network info.
DNS issues: Some ISPs may have slower DNS resolution. Use chrome://net-export and check DNS resolution times; consider switching to a faster DNS like Google DNS (8.8.8.8) or Cloudflare (1.1.1.1).
Network bandwidth/metered plans: If your plan has data caps, check chrome://settings/performance (if available) to enable Memory/Tab Saver or limit background tabs.
Extensions with regional conflicts: Some video streaming or payment-gateway extensions may misbehave. Use chrome://extensions-internals to test disabling those selectively.
Managed devices: Many corporate setups in India/Delhi have device policies. chrome://policy will show you if Chrome is part of a managed fleet (which can restrict updates/extensions).
Safety & Precaution
- Some internal URLs can crash or hang the browser if used incorrectly. For example,
chrome://crashorchrome://memory-exhaustare known to intentionally destabilize Chrome. - These pages are meant for diagnostics/debugging; modifying flags/experimental features without understanding may cause instability or data loss. Always backup important data (bookmarks, passwords, etc) before extensive changes.
- If your browser is managed by your workplace (check
chrome://managementorchrome://policy), changing flags or disabling policies might breach terms of use; proceed with caution or contact IT.
Troubleshooting Flow Recap
- Identify the symptom (slow, crash, GPU issue).
- Use version & channel check (
chrome://version). - Use hardware/network diagnostics (
chrome://gpu,chrome://net-export). - Check extension/policy status (
chrome://extensions-internals,chrome://policy). - Use component/page logs (
chrome://components,chrome://crashes,chrome://system). - Modify only one thing at a time (disable one extension, change one flag) and test.
- If issue resolves, note the change. If not, revert and try next step.
- For network issues, export logs and share with IT or ISP if needed.
- For GPU/hardware issues, update drivers and test again.
- Maintain backups and keep browser/OS updated.
Advanced Tips & Tricks
- Use profiles: Create a fresh Chrome profile to test if problems are profile-specific (bookmarks, extensions, cookies).
- Use incognito mode +
chrome://extensions-internalsto test with no extensions. - Use Task Manager inside Chrome (
Shift + Esc) to see which tab/extension is hogging memory/CPU. - Use DevTools (F12) along with
chrome://tracingfor detailed performance traces. - Use Chrome cleanup tools (Settings → Reset) when suspecting malware or corrupt installations.
- Keep an eye on flag deprecations: internal pages sometimes get removed/replaced (e.g.,
chrome://net-internalsreplaced withchrome://net-export).
When to Consider a Full Reset or Reinstall
If after diagnostics and trying the above steps Chrome still:
- Crashes frequently
- Remains extremely slow despite clearing caches
- Cannot load certain pages or network logs show consistent DNS/connection errors
- Shows many hardware acceleration errors in
chrome://gpu(and driver update doesn’t help)
…then it may be time to:
- Backup bookmarks, extensions list, passwords
- Fully uninstall Chrome
- Delete the user profile folder (so you start fresh)
- Reinstall the latest stable version
- Re-import only necessary extensions
- Avoid restoring old profile if you suspect it was corruption source
Conclusion
The secret diagnostic URLs in Chrome unlock a powerful set of tools for diagnosing, troubleshooting and optimizing your browser experience. Whether you’re dealing with slow loading pages, crashes, GPU issues or network weirdness – knowing which page to open and what to look for can save significant time and effort.
By following the structured workflows above, using the tables and recommendations, you can transform from frustrated user to informed troubleshooter. Always remember to proceed carefully, back up data, and when in doubt revert changes.
Your browser is a key gateway to the web; making it reliable, fast and secure improves your daily productivity, especially in a connected world (like Delhi/NCR or globally). Use these internal tools wisely – you now have a map of the hidden under-hood of Chrome.